Contents
Introduction
This is very simple and tutorial post for doing Machine Learning in Groovy. This post covers the clustering algorithms such as,
- DBSCAN - Density-Based Spatial Clustering of Applications with Noise
- KMean++
- FuzzyKMean
- Multi-KMean++
These algorithms differs in their motivation and working methodology. The simple and best summary of these algorithms discussed in Math3 Java Documentation.
View the Document here.
Libraries
- Apache Math3 for Machine Learning.
- JFree Chart for Visualization.
Steps
The source code also shared in GitHub, you can find it in above shared link. Here Again I am sharing with some explanation,
Source Code
class ClusterWork
{
    List<DoublePoint> points = new ArrayList<DoublePoint>()
    Map<DoublePoint, List<String>> pointMap = [:]

    ClusterWork(Map table)
    {
        table.each{ k,v ->
            DoublePoint dArr = new DoublePoint(v)
            points.add(dArr)
            if (!(dArr in pointMap.keySet()))
                pointMap[dArr] = []
            pointMap[dArr].add(k)
        }
    }
    List<ClusterDetail> dbscan (double d, int i)
    {
        DBSCANClusterer DBScan = new DBSCANClusterer(d, i)
        collectDetails DBScan.cluster(this.points)
    }
    List<ClusterDetail> fuzzykmean (int k, double fuzziness)
    {
        FuzzyKMeansClusterer fKMean = new FuzzyKMeansClusterer(k, fuzziness)
        collectDetails fKMean.cluster(this.points)
    }
    List<ClusterDetail> multiplekmean (int k, int trials)
    {
        MultiKMeansPlusPlusClusterer mkppc = new MultiKMeansPlusPlusClusterer(new KMeansPlusPlusClusterer(k), trials)
        collectDetails mkppc.cluster(this.points)
    }

    List<ClusterDetail> kmean (int k)
    {
        KMeansPlusPlusClusterer kMean = new KMeansPlusPlusClusterer(k)
        collectDetails kMean.cluster(this.points)
    }
    private List<ClusterDetail> collectDetails(def clusters)
    {
        List<ClusterDetail> ret = []
        clusters.eachWithIndex{ c, ci ->
            c.getPoints().each { pnt ->
                DoublePoint pt = pnt as DoublePoint
                ret.add new ClusterDetail (ci + 1 as Integer, pt, this.pointMap[pt])
            }
        }
        ret
    }
}
class ClusterDetail
{
    int cluster
    DoublePoint point
    List<String> labels
    ClusterDetail(int no, DoublePoint pt, List<String> labs)
    {
        cluster = no; point= pt; labels = labs
    }
}
Run Algorithm
Running algorithm has multiple steps like showing below,
- Step 1. Import all required
- Step 2. Read a csv file for input data
- Step 3. Converting it into required data type (Here as Map)
- Step 4. Construct the source code class
- Step 5. Run all algorithms above listed
Step 1 :
@Grab('com.xlson.groovycsv:groovycsv:1.1')
@Grab(group='org.apache.commons', module='commons-math3', version='3.6.1')
import org.apache.commons.math3.ml.clustering.DBSCANClusterer
import org.apache.commons.math3.ml.clustering.DoublePoint
import org.apache.commons.math3.ml.clustering.FuzzyKMeansClusterer
import org.apache.commons.math3.ml.clustering.KMeansPlusPlusClusterer
import org.apache.commons.math3.ml.clustering.MultiKMeansPlusPlusClusterer
import static com.xlson.groovycsv.CsvParser.parseCsv
// All imported
Step 2 :
//Read the csv input data
df = new FileReader('data.csv')
Step 3 :
Map<String, double[]> dfMap = [:]
for (line in parseCsv (df))
{
    double [] point= [line.temp.toDouble(), line.humidity.toDouble()]
    dfMap[line.city] = point
}
// Map dfMap formed.
Step 4 :
// Construct the cluster work using our Map
ClusterWork clusterWork = new ClusterWork (dfMap)

// Simple print closure implementation
def showClosure = {detail ->
println "Cluster : " + detail.cluster + " Point : " + detail.point + " Label : "+ detail.labels
}
Step 5 :
// Running All algorithms accordingly
println 'DBSCAN'
clusterWork.dbscan(6, 0).each(showClosure)
println '-----------'

println 'Kmean'
clusterWork.kmean( 5).each(showClosure)
println '-----------'

println 'FuzzyKMean'
clusterWork.fuzzykmean(5, 300).each(showClosure)
println '-----------'

println 'MultipleKMean'
clusterWork.multiplekmean(5, 5).each(showClosure)
println '-----------'
Results
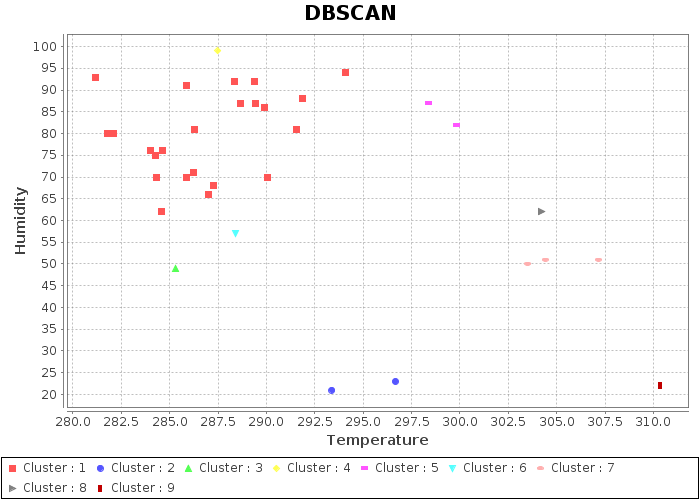
Here I have attached the sample output for DBSCAN algorithm.
DBSCAN Cluster : 1 Point : [284.624954535, 76.0] Label : [Vancouver] Cluster : 1 Point : [282.100480976, 80.0] Label : [Portland] Cluster : 1 Point : [281.78244858, 80.0] Label : [Seattle] Cluster : 1 Point : [286.213142193, 71.0] Label : [Saint Louis] Cluster : 1 Point : [283.994444444, 76.0] Label : [Indianapolis] Cluster : 1 Point : [284.278140131, 75.0] Label : [Detroit] Cluster : 1 Point : [286.276495879, 81.0] Label : [Toronto] Cluster : 1 Point : [290.07866575, 70.0] Label : [Kansas City] Cluster : 1 Point : [287.009165955, 66.0] Label : [Minneapolis] Cluster : 1 Point : [284.300133393, 70.0] Label : [Chicago] Cluster : 1 Point : [285.85044048, 70.0] Label : [Philadelphia] Cluster : 1 Point : [287.277251086, 68.0] Label : [Boston] Cluster : 1 Point : [291.553209206, 81.0] Label : [San Diego] Cluster : 1 Point : [284.59253007, 62.0] Label : [Denver] Cluster : 1 Point : [289.89855969, 86.0] Label : [Dallas] Cluster : 1 Point : [289.446243412, 87.0] Label : [San Francisco] Cluster : 1 Point : [291.857503395, 88.0] Label : [Los Angeles] Cluster : 1 Point : [288.650991196, 87.0] Label : [Charlotte] Cluster : 1 Point : [289.373344722, 92.0] Label : [San Antonio] Cluster : 1 Point : [288.371111111, 92.0] Label : [Houston] Cluster : 1 Point : [285.860929124, 91.0] Label : [Montreal] Cluster : 1 Point : [294.064062959, 94.0] Label : [Atlanta] Cluster : 1 Point : [281.151870096, 93.0] Label : [Pittsburgh] Cluster : 2 Point : [293.381212832, 21.0] Label : [Las Vegas] Cluster : 2 Point : [296.654466164, 23.0] Label : [Phoenix] Cluster : 3 Point : [285.313345004, 49.0] Label : [Albuquerque] Cluster : 4 Point : [287.48791359, 99.0] Label : [Nashville] Cluster : 5 Point : [298.393960613, 87.0] Label : [Jacksonville] Cluster : 5 Point : [299.800641223, 82.0] Label : [Miami] Cluster : 6 Point : [288.406203155, 57.0] Label : [New York] Cluster : 7 Point : [307.145199718, 51.0] Label : [Beersheba] Cluster : 7 Point : [304.4, 51.0] Label : [Haifa, Nahariyya] Cluster : 7 Point : [303.5, 50.0] Label : [Jerusalem] Cluster : 8 Point : [304.238014609, 62.0] Label : [Tel Aviv District] Cluster : 9 Point : [310.327307692, 22.0] Label : [Eilat]
The JFree Chart visualization of all algorithms with cluster details attached accordingly. The JFree chart requires other dependencies such as,
- JCommon
- JFreeChart
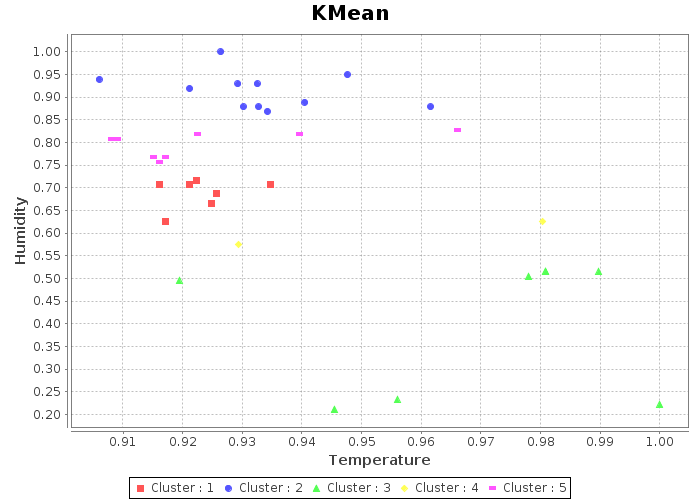
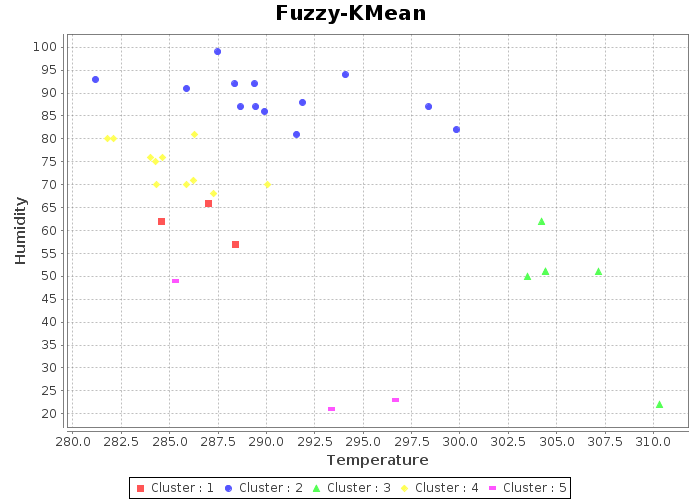
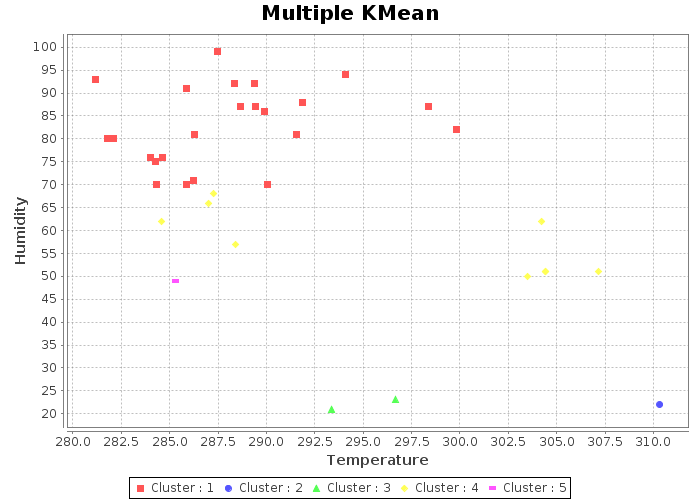
Scatter plot is used to visualize the clusters. The result plots are,
DBSCAN

KMean

Fuzzy KMean

Multiple KMean

References
Thanks to the sources, 1. Machine Learning with Math3 2. JFree Chart Doc 3. Tutorials Point - JFree chart

Related Posts
Machine Learning Basic Questions And Answers
Docker Containers Most Asked Questions And Answers